![\includegraphics[width=0.5\textwidth]{unk03_fig1}](img59.gif) |
![\includegraphics[width=\textwidth]{unk02a_fig2}](img60.gif) |
The schematic energy band structure of the resonant tunneling diode (DBRT) is shown in Fig. 2.
The electrons tunnel from the emitter contact through the left barrier into the quantum well
and from there through the right barrier to the collector. The dynamical
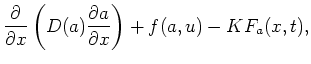
variables in this case are the space-dependent electron density ![]() in the quantum well
(activator), as well as the voltage applied to the tunneling diode
in the quantum well
(activator), as well as the voltage applied to the tunneling diode ![]() (inhibitor)
(each in dimensionless units), where
(inhibitor)
(each in dimensionless units), where ![]() is the transverse spatial coordinate vertical to the
current transport direction. Based on our previous work on transverse dynamics
[6,8], the next task was the microscopic calculation of the tunneling
currents
is the transverse spatial coordinate vertical to the
current transport direction. Based on our previous work on transverse dynamics
[6,8], the next task was the microscopic calculation of the tunneling
currents ![]() and
and ![]() [16].
Expanding the model by adding control forces
[16].
Expanding the model by adding control forces
![]() ,
, ![]() , one obtains in appropriate units a system of equations of the form
, one obtains in appropriate units a system of equations of the form
Without control, ![]() , we found transverse trigger fronts in the bistable regime [26],
stochastic pulse trains in the excitable regime [25] and breathing current filaments
and spatiotemporal spiking in the oscillatory regime [16].
, we found transverse trigger fronts in the bistable regime [26],
stochastic pulse trains in the excitable regime [25] and breathing current filaments
and spatiotemporal spiking in the oscillatory regime [16].
Our research in collaboration with P. Rodin (St. Petersburg)
showed that the dynamical behaviour of the DBRT can be chaotic when an electric circuit acts on
the device [37]. Formally this can be achieved
by choosing a negative ![]() in Eq. (9).
Thus we could prove both breathing and spiking chaotic behaviour as shown
in Fig. 2.5. The complete bifurcation diagram in
Fig. 2.6 shows a complex bifurcation scenario, which was further examined
in [25].
in Eq. (9).
Thus we could prove both breathing and spiking chaotic behaviour as shown
in Fig. 2.5. The complete bifurcation diagram in
Fig. 2.6 shows a complex bifurcation scenario, which was further examined
in [25].
![\includegraphics[width=0.6\textwidth]{unk03_fig_6}](img77.gif) |
![\includegraphics[width=\textwidth]{unk03_fig_13}](img78.gif) |
Now we switch on the control, i.e. ![]() [25].
The aim here was to compare the effectiveness of various control methods.
Our starting point is the theoretically well understood diagonal control
[25].
The aim here was to compare the effectiveness of various control methods.
Our starting point is the theoretically well understood diagonal control
![]() ,
,
![]() , where
, where
![]() and
and
![]() are calculated
similarly to (3) and (4). As already done for the generic model in (i),
we can numerically reproduce analytical conditions for successful control
also for the DBRT model
(5) [25].
are calculated
similarly to (3) and (4). As already done for the generic model in (i),
we can numerically reproduce analytical conditions for successful control
also for the DBRT model
(5) [25].
For local control without voltage feedback, i.e. ![]() ,
,
![]() , the control regime deforms as in
Fig. 7(a). Floquet diagrams are essential for
the bifurcation analysis as shown in
Fig. 7(b). In this case it follows from
the Floquet diagram, that the left boundary of the control regime is associated with a
flip bifurcation whereas the lower and right boundary are each associated with
Hopf bifurcations.
, the control regime deforms as in
Fig. 7(a). Floquet diagrams are essential for
the bifurcation analysis as shown in
Fig. 7(b). In this case it follows from
the Floquet diagram, that the left boundary of the control regime is associated with a
flip bifurcation whereas the lower and right boundary are each associated with
Hopf bifurcations.
The most suitable control scheme for practical applications is a
pure voltage feedback,
![]() ,
, ![]() , where
the physically easily accessible voltage variable is used in the control.
We managed with this simple method
to stabilize an unstable periodic spatiotemporal orbit for the DBRT.
[25]. The control regime (cf. Fig.8(a)) is
is in comparison to diagonal control obviously smaller, which can also be seen
in the corresponding Floquet diagram (Fig.8). Further interesting control schemes
arise by choosing a spatially averaged control force
, where
the physically easily accessible voltage variable is used in the control.
We managed with this simple method
to stabilize an unstable periodic spatiotemporal orbit for the DBRT.
[25]. The control regime (cf. Fig.8(a)) is
is in comparison to diagonal control obviously smaller, which can also be seen
in the corresponding Floquet diagram (Fig.8). Further interesting control schemes
arise by choosing a spatially averaged control force
![]() [25].
[25].
![\includegraphics[width=\textwidth]{unk03_fig_12}](img81.gif)